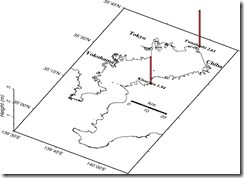
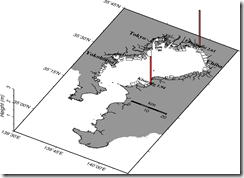
GMT 3D bar graph for tsunami heights in a bird’s eye view using map3d.sh
A sample bash script to draw a GMT 3D bar graph for tsunami heights in a bird’s eye view. Cstline.xyz is coastline data file and ynu_taisei.d is the tsunami heights data with location. When drawing coastlines, it is necessary to sample the data within the focusing region using gmtselect, or the coastlines may also be drawn outside the map region.
#!/bin/bash
# bash script for drawing a 3d tsunami height map using GMT
#   Coded on Oct. 9, 2011 by Jun Sasaki
#   Input data: Coastline data and tsunami height data
# USAGE:  $ sh gmt_map3d.sh
##################################
ps=map3d.ps
rxy=139:30:00/140:10:00/34:50:00/35:45:00  # xmin/xmax/ymin/ymax
rxyz=$rxy/0/3  # zmin/zmax
proj=M12c  # x-y map projection
projz=5c   # z projection
mapscale=140:00:00/35:15:00/35:15:00/20k+l # map scale used by psbasemap
angle=150/40  # bird's eye view angle, e.g., 150/40,  plan view: 180/90
pen=2/0/0/0   # thickness/r/g/b
barcolor=255/0/0  # r/g/b
gmtset LABEL_FONT_SIZE 16  # font size of mapscale label
gmtset ANNOT_FONT_SIZE 14
gmtset ANNOT_FONT2_SIZE 14
gmtset PLOT_DEGREE_FORMAT ddd:mm:ssF  # F means attached N and E
# -B should be directly put in psbasemap. Or it does not work if there is space.
##################################
#pscoast -R$rxyz -J$proj -Df -G150/150/150 -E$angle -K >$ps
psbasemap -Ba15mf5mg0m:,E:/a15mf5mg0m:=N:/a1f0.5g0.5:"Height (m)":WSneZ -J$proj -JZ$projz -R$rxyz
 -Lf$mapscale -E$angle -K >$ps
### Draw coastlines: data sampling required with gmtselect to supress lines outside the domain
gmtselect Cstline.xyz -m -R$rxy | psxyz -m -R$rxyz -J$proj -JZ$projz -W$pen -K -O -E$angle >>$ps
### Draw tsunami height bars
psxyz ynu_taisei.d -R$rxyz -J$proj -JZ$projz -So0.1c -G$barcolor -Wthinner -K -O -E$angle >>$ps
### Draw texts for tsunami height and station name
awk '{print $1, $2, 14, 0, 5, "BC", $4, $3}' ynu_taisei.d | pstext -R$rxyz -J$proj -JZ$projz
 -E$angle -K -O >>$ps  # This line should not be the last because of -K -O issue.
echo "139:40:00 35:37:00 18 0 5 BC Tokyo" | pstext -R$rxyz -J$proj -JZ$projz -E$angle -K -O >>$ps
echo "139:35:20 35:25:00 18 0 5 BC Yokohama" | pstext -R$rxyz -J$proj -JZ$projz -E$angle -K -O >>$ps
echo "140:07:00 35:37:00 18 0 5 BC Chiba" | pstext -R$rxyz -J$proj -JZ$projz -E$angle -O >>$ps

rm ${ps%.*}.eps
ps2eps -f $ps  # PS -> EPS
gv -orientation=landscape ${ps%.*}.eps  # Draw EPS using gv
rm $ps
ps2raster ${ps%.*}.eps -Tg  # convert to PNG
The format of Cstline.xyz should be as follows where “>” is a separator for line segments and the columns are x (longitude), y (latitude), and z (height), respectively. Since it is coastlines, all the z values are zero.
>
     140.11124806  35.58658833 0.0
     140.11252472  35.58113917 0.0
     140.11209389  35.58056250 0.0
     140.11265333  35.57828111 0.0
     140.11295583  35.57830361 0.0
     140.11301028  35.57808778 0.0
>
     140.11301028  35.57808778 0.0
     140.11318500  35.57739722 0.0
     140.11308389  35.57734306 0.0
     140.11412833  35.57256222 0.0
     140.11390611  35.57231556 0.0
     140.11183111  35.57220417 0.0
     140.11187722  35.57177639 0.0
     140.11198278  35.57147556 0.0
     140.11209722  35.57094583 0.0
     140.11211417  35.57086806 0.0
The format of “ynu_taisei.d” should be as follows where the first three columns denote longitude, latitude tsunami height, and name of location, respectively, and the remaining columns denote comments.
139:59:01.3 35:41:23.7 2.61 Funabashi #Funabashi Fishery Port WM1 [I]
139:54:54.6 35:22:53.8 1.94 Kisarazu #Kisarazu Fishery Port WM1 [I]
Following are sample figures. The second one is drawn with optional pscoast. However, the coastlines of pscoast are outdated especially in Tokyo Bay and thus there is significant difference with the present coastlines.


